
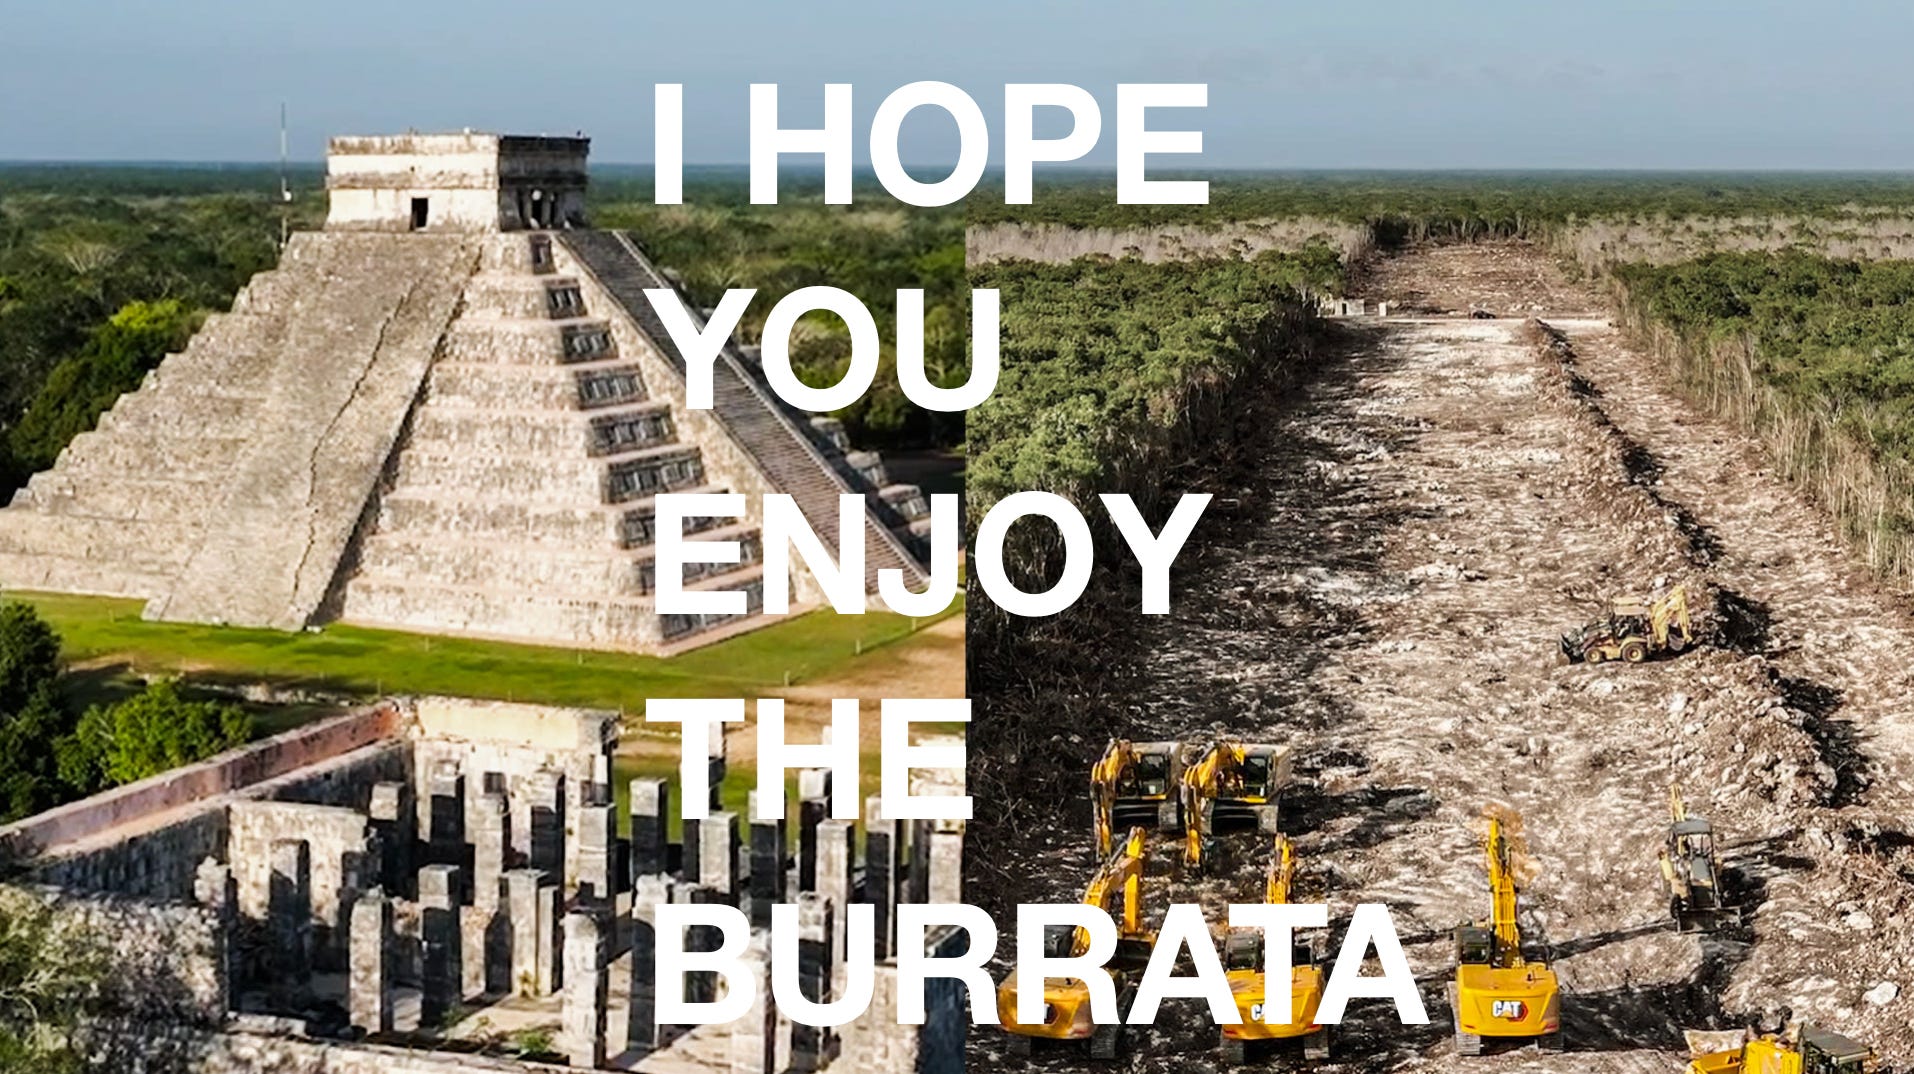
I Hope You Enjoy the Burrata
How It Places collapse in 7 acts. From whispered retreats to crypto condos, this is the data-driven anatomy of aesthetic death by algorithm.

If Proximity Collapse was diagnosis, this is dramaturgy. We’re no longer just naming the symptoms, we’re staging the play.
Because let’s be honest: once two of your lead case studies are Santorini and Mykonos, this isn’t cultural criticism anymore, it’s literal Greek tragedy.
And like all tragedies, this one is timeless, predictable, and entirely avoidable… until it isn’t.
Act I: The whisper. No tags, no signage, just a sommelier in Paris murmuring “Sumba” over pét-nat.
Act II: The Aman opens. The linens are stonewashed. Tilda Swinton is holding a goat.
Act III: A girl from Toronto with 11k followers arrives and says “just sharing 💫✨🧿.”
Act IV: Soho House. €480 beach beds. Floating breakfasts. Everyone’s still pretending it’s a secret.
Act V: Someone posts “Is Tulum over?”
Act VI: It is.
This is the lifecycle of the It Place: a six-stage collapse machine powered by aesthetic capital, algorithmic acceleration, and crypto-backed burrata. If you’re lucky, you might get a surprise seventh stage (but only 15% of locations do). In this essay, we chart how every destination becomes a parody of its own marketing within 18–36 months (or six, if TikTok’s involved). We’ll graph content decay, model brand arrival tipping points, and explain why the appearance of Equinox is not a luxury amenity but a red flag.
Today We’re Talking About:
How every “It Place” is really just a Greek tragedy in linen, and why that dreamy spot you’re eyeing is already in Act IV: Ironic TikTok Redemption
The exact second a destination dies (spoiler: it’s when someone says “just sharing” and tags it #hiddenparadise)
What happens when the algorithm shows up: €4500 hotel suites, 300% real estate spikes, influencer residencies, and salads priced like rare watches
Why a Nobu opening means you’ve got 12 months before the crypto bros and content fams arrive (and how to read every brand like a stage cue)
What happens when AI-curated travel starts skipping humans entirely
Why Instagram drags, Pinterest dreams, and Twitter kills (and what each platform actually tells us about the death spiral ahead)
The full seven-act structure of destination collapse, from Parisian sommeliers and no-tags to crypto co-living and Zara by the beach
Why 85% of destinations never make it back, and what the 15% who do have in common (hint: it’s not marketing, it’s programming)
And the only question that matters in 2025: not “Should I go?” but “Which phase of the collapse am I paying to participate in?”
If you missed it, you can read the first drop here (open to all):

and the intro explaining the series (open to all):

But today’s piece? That’s just for full subscribers. To access this essay, the full Lifecycle of the It Place series, and over 100 original charts, saturation models, and visual trend maps, Subscribe now. The spiral won’t wait.
Part 3 will drop next and will be open to everyone.
The Quant Drop: How This Series Was Built
This isn’t vibes. This isn’t aesthetic intuition. And it’s definitely not a “2025 hotlist.”
This is the most comprehensive data model of destination saturation ever published outside a tourism ministry PowerPoint, and possibly inside one. To trace the rise and collapse of “It Places,” we built a seven-stage lifecycle framework, layered 25 custom charts, and stitched together platform velocity data, real estate inflation, sentiment backlash, and brand timing signals across 20+ global destinations.
Here’s how we built it.
Core Datasets: Demand, Decay, and Desirability
Instagram + TikTok Hashtag Velocity (2015–2025): Monthly tracking across 27 destinations. Used to model symbolic saturation and visual template formation. We defined flattening as exceeding 1M posts with declining content diversity.
Google Trends Interest: Global searches for terms like “hidden gem + [destination]” and “best time to visit [X]” indexed against charted platform ignition points.
Luxury Hotel Price Growth (ADR): Tracked via STR Global, brand investor disclosures (Marriott, Accor, Hyatt), OTA scraping, and tourism board filings. Used to model hype inflation and price deflation post-saturation.
Property Price Multipliers: Data from Eurostat, Knight Frank, regional land registries, and destination-specific sources. Focus: Tulum, Setouchi, Mykonos, Comporta, Palm Springs.
Pinterest Save Density: Captured via Tailwind, influencer media kits, and board scraping. Used to identify “template saturation” thresholds, when fantasy precedes failure.
YouTube + Reddit Activity: Quantified itinerary convergence (YouTube) and backlash escalation (Reddit threads). Data points included view velocity and recurrence of “overrated” discourse.
X/Twitter Discourse Contamination Index: Custom-coded sentiment analysis scraping keywords like “theme park,” “hell,” and “used to be special” and tracking their correlation with virality lag.
Brand Signal Matrix: The Opening Is the Oracle
95 brand entries mapped across 30 destinations: We linked opening timelines (Nobu, Soho House, Starbucks, Aman, Barry’s Bootcamp) to price trajectories, hashtag climbs, and platform backlash points.
Source materials: Condé Nast Traveller, Skift, Hotelier Middle East, company press releases, investor calls, and development deal trackers.
Lifecycle Classification: Every brand was tagged to one of seven stages: Obscurity → Ignition → Platform Leakage → Saturation → Collapse → Plateau → Rebirth. Yes, including crypto real estate.
Expert Input & Secondary Source Integration
Virtuoso Travel Week whitepapers (2020–2024)
Skift Megatrend Reports (2021–2025)
Indagare, XO Private, and Black Tomato interviews
Academic literature on overtourism, cultural flattening, and mimetic desire
(Shoutout to René Girard, who basically predicted TikTok.)
Visualisation Frameworks: 25 Custom Charts
All visuals in this piece were generated from a unified trend-mapping engine. No stock slides. No repurposed decks. Just beautifully depressing insight.
The Lifecycle Spiral (7-stage model)
Platform Acceleration Overlay (Pre-Social vs Instagram vs TikTok vs AI)
Real Estate Price Trajectory Models (per destination)
Brand Invasion Timelines (with economic breakpoints)
Visual Redundancy & Content Decay Charts
Saturation Countdown Clocks
Recovery ROI Grids + Rebirth Pattern Curves
This is not just where not to go. This is how taste dies, in quantifiable steps — and who profits from its corpse.
If you want all 9 essays, every data visualisation, and the ability to spot a burrata death spiral from 18 months out, you’ll need to subscribe.
Because the collapse is predictable and also now it’s trackable.
