
Why is Broadway Losing to London's West End?
The failing economics behind who gets in the room and what stories are told

Broadway is losing to London’s West End on every dimension that matters in a functioning culture market: speed & scale of recovery since Covid, access & price, creative pipeline, and unit economics (the basic weekly costs to run a show). And with the ongoing threat to U.S. arts funding, these gaps will only accelerate.
This series attempts to quantify how two operating models spill into regions, seasons, and livelihoods depending on whether a society treats the arts as civic infrastructure or as a luxury.
Why the split? Two stages and two very different operating systems (OS):
London runs a subsidy-led system: a permanent Theatre Tax Relief (a cash refund on qualifying production costs) backed by Arts Council England (ACE). That lowers break-even (the weekly income a show needs to cover its costs) and lets a wider mix of shows open and survive. More originals; more time to find an audience.
New York runs a scarcity-and-rent system: no public support, higher weekly running costs, a handful of landlords controlling most theatres, and heavier premium pricing (charging much more for the hottest seats). Shorter runs; fewer chances for new work to be discovered.
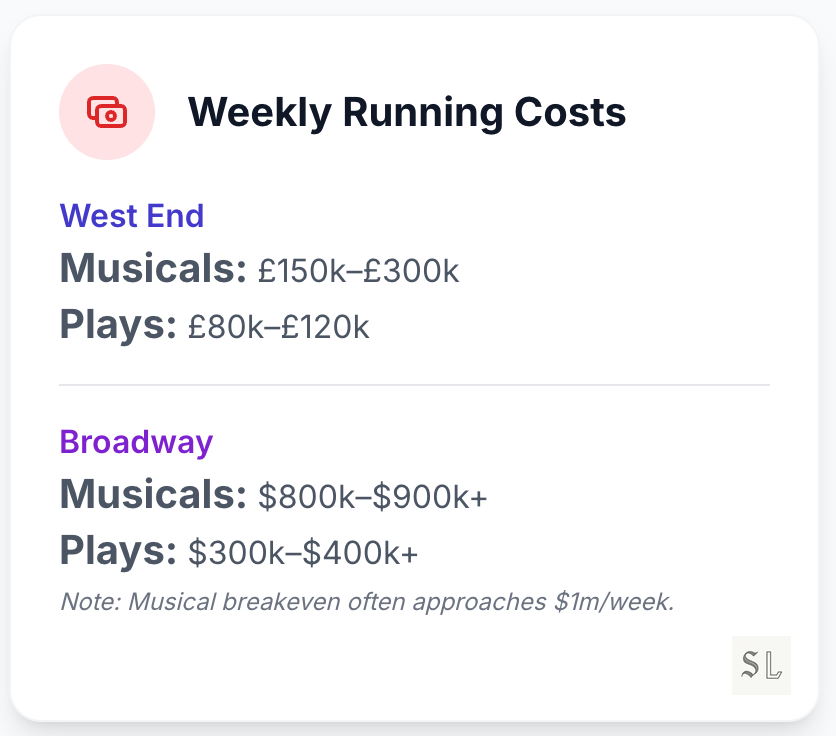
Under the hood: many Broadway musicals now carry >$800–900k in weekly running costs with break-even ≈ $1m/week. Comparable West End musicals often live at ~£150–300k/week, with plays commonly ~£80–120k/week.
That delta explains why Broadway leans on premium ticket prices and star/IP vehicles (adaptations of things you already know), and why London can keep more mid-scale originals on stage long enough to be found.
In simple terms, this is why London’s West End has more original and interesting work, and even more telling for what’s ahead: why more original shows now open in London first and then (maybe) transfer to Broadway with much less risk priced in (see Jamie Lloyd’s Sunset Blvd and Stranger Things below).
This series isn’t an “arts for arts’ sake” lament (even though that should be reason enough). We’re taking a political-economy angle (how this art form shapes discourse and markets) in order to engage those without a predisposition towards valuing and supporting the arts.
Politics (civic function): Since ancient Athens where the city subsidised theatre attendance via the theorikon (a public stipend so ordinary citizens could afford festival tickets) as part of democratic civic life, mid-scale theatre (non-spectacle new work) has been a place where cities practise pluralism. When it shrinks, democracy shrinks. Live performance is one of the last rooms where strangers share a non-personalised feed (the same story at the same time) and negotiate meaning in public.
Economics (productive capital): Theatres are productive assets, not ornaments. In the UK, Theatre Tax Relief (now 40% for West End or 45% for touring) on up to 80% of eligible costs has a clear multiplier: every £1 of public relief crowds in ≥£4 of production spend. In New York, every $1 of Broadway ticket revenue links to roughly $9–$10 of wider city spend across the night-time economy (dining, hotels, transport, retail), supporting ~97,000 jobs. Remove the mid-scale tier and you cut the innovation engine, the skills pipeline, and those local multipliers.
The uncomfortable questions we’ll answer in this series
If London can premiere your favourite American stories first, what does “Broadway” mean now for American artists and audiences?
Are record Broadway grosses hiding a thinner culture? (Fewer shows, higher prices, mid-scale squeezed.)
What happens to the American musical if mid-scale risk disappears? (The touring circuit is the market but that, too, is under threat. Kill the pipeline and cities go dark.)
Why can an award-winning, sell-out play barely profit in New York? (Weekly costs, %-of-gross rent, stop-clauses.)
Who loses and what happens when federal arts funding is under threat?
What’s ahead (three-part series)
Part I (this essay): Two systems, one artform. How London funds rehearsal and New York taxes risk: cost stacks, price distributions, gatekeeper power, and policy design.
Part II: The tour is the real market. More people see live theatre outside NYC and London than within. We’ll see how policy decides who actually gets culture beyond the elite cities and capitals. Stakes: which towns go dark, which titles scale down or skip markets, and where do the arts entirely disappear.
Part III: NEA futures. What the National Endowment for the Arts (NEA) actually funds, and what a federal pause/cut would do to America’s cultural network and pipeline. Clear scenarios, hard numbers, no (unwarranted) melodrama.
🔐 Why subscribe (what you unlock)
Operator Playbook, in full: launch decision tree, London-first finance mechanics, NYC right-sizing tactics, pricing architecture, deal levers that buy runway, and a one-page checklist you can use with your team today.
Execution tools: KPI spine (discovery window, comfort-price share, repertoire entropy), target bands, and simple templates for tracking them.
Data & methods appendix: clear sources, assumptions, and the “how we got the numbers” notes for every claim; ready to share with finance, producing, or policy colleagues.
Practical prompts: negotiation clauses that extend discovery windows, access-pricing patterns that raise utilisation, and touring package choices that preserve margin.
Q&A and updates: subscriber-only follow-ups as new seasons finalise, plus quick reads on the three health tests to watch each quarter.
To read more on the live entertainment business, make sure to check out our previous dive into new formats and models.

Let’s begin.
How Broadway Is Losing Across the Four Quadrants
1. Volume & speed
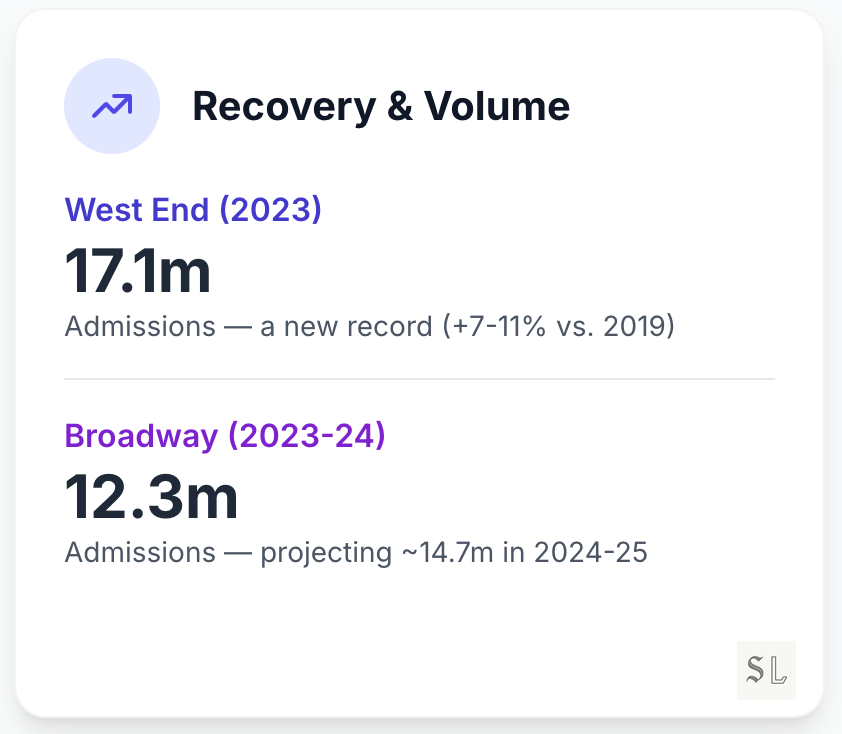
Since Covid, London rebuilt faster and kept more productions in circulation, so an ordinary week still offers genuine choice. New York recovered later and did it more through higher prices than through adding shows, which means that even when houses feel full, the slate is thinner and the options narrower.
2. Access & price
London keeps a visible supply of cheap seats, plus reliable day-seat/rush options (same-day, low-price tickets). Broadway relies more on a small slice of very expensive seats that push the average up. The effect is simple: in London, theatre can be a regular habit and in New York, it’s more often a planned special occasion.
3. Creative pipeline (where new works begin)
The UK’s Theatre Tax Relief, a cash refund of 40–45% on up to 80% of eligible costs, works like public R&D: it lowers break-even (the weekly income needed to cover costs) and spreads early risk. So more mid-scale new shows open there first, build word-of-mouth, and transfer. For American audiences and artists, that means more premieres abroad and fewer first looks at home unless a show arrives with enough star power to clear Broadway’s higher costs.
4. Unit economics
Weekly running costs and the break-even point matter. On Broadway the weekly nut (what it costs to keep the show open each week) is so high that productions need near-record box office just to break even. In the West End the lower nut gives shows breathing room. Broadway’s stop-clauses (contract terms that let a landlord close or move a show after a couple of weak weeks) cut the discovery window short. Audiences feel this as shorter runs, fewer slow-burn, word-of-mouth successes, and a slate tilted toward stars/IP (pre-sold brands).
Net effect
Put the four forces together and you get two very different worlds. In New York, higher costs, landlord incentives (a cut of gross and stop-clauses), and premium pricing compress time. In NYC, shows close sooner, you see fewer experiments, and the slate clusters around tent-poles. In London, policy support (tax relief) and more flexible deal shapes buy time. Shows get longer runways, there’s more genuine discovery, and a broader canon takes shape.
Drivers of the Delta
This is the machinery behind the gap. More levers (venue monopolies, labour & pit sizes, theatre rent model, and marketing/overhead) compound to push Broadway’s weekly nut (running cost) far above the West End’s.
Who owns the rooms (consolidation)
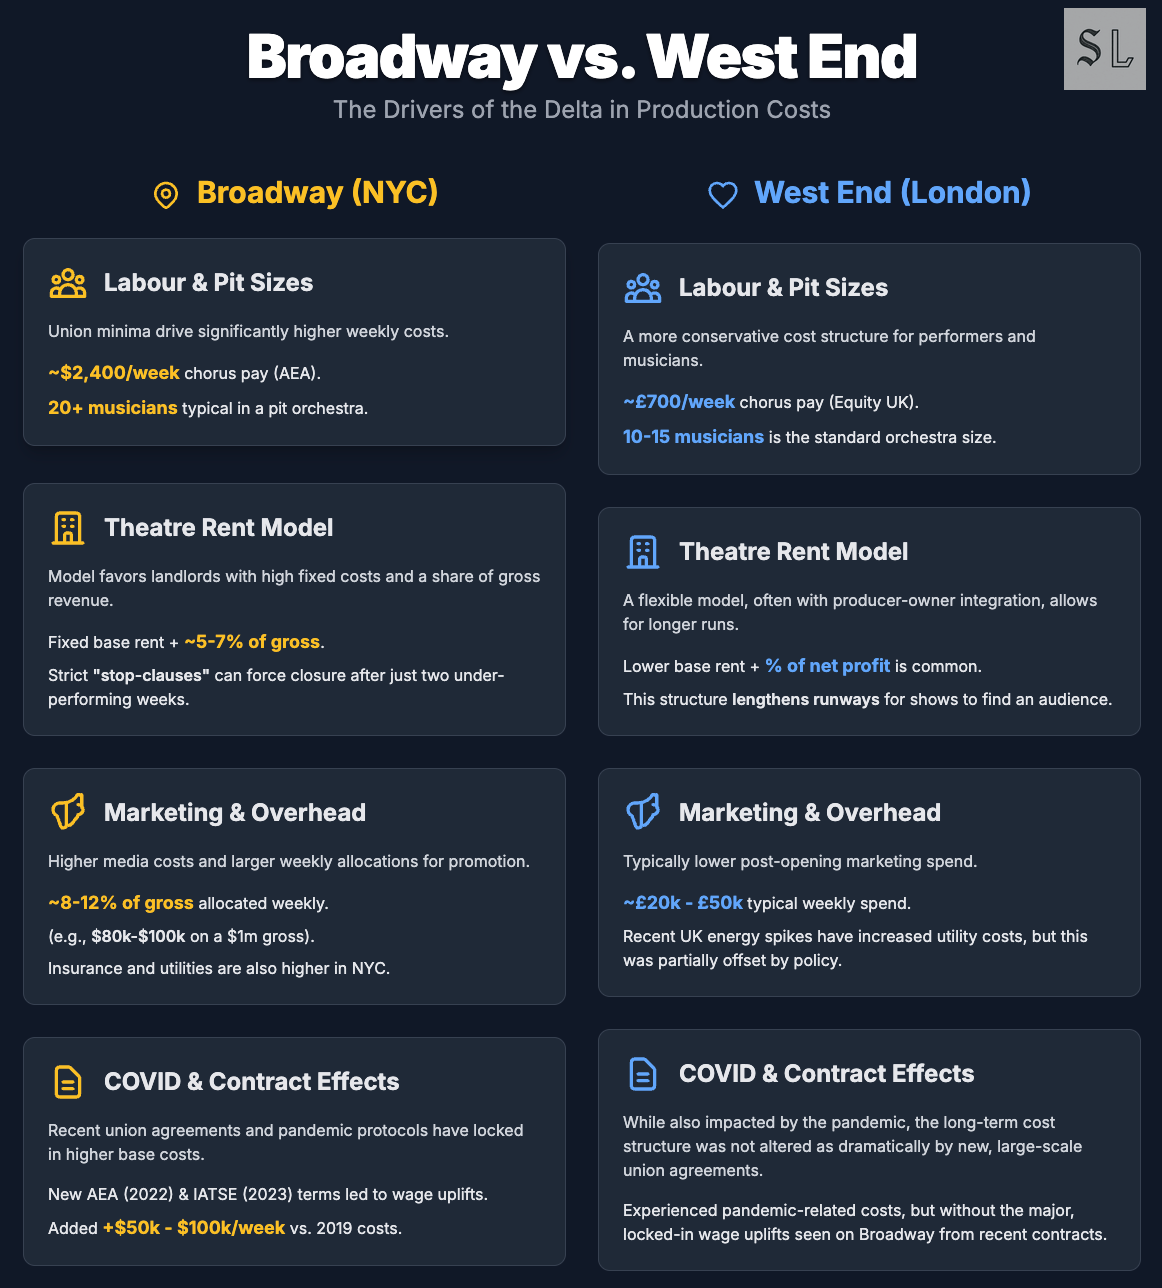
Broadway (NYC): three landlords dominate bookings. Shubert, Nederlander, Jujamcyn/ATG control ~31 of 41 houses. That concentration gives landlords real power over what runs and for how long.
West End (London): concentrated too, but less so (ATG, Delfont Mackintosh, LW, Nimax, Nederlander UK), and owners often co-produce, which softens pure landlord incentives.
How the rent works (deal shape)
Broadway: You pay a fixed weekly rent plus a cut of your ticket sales (usually ~5–7%). Gross means the money in before most deductions. This setup rewards higher prices and quick turnover. If a pricier show can earn more, the landlord has reason to swap it in fast.
West End: You typically pay a lower fixed rent, with more profit-share or % of net deals (net = what’s left after costs), often with some venue costs bundled. There are also more room sizes to match demand. This setup rewards right-sizing and longer runs, giving shows more time to find an audience.
Labour & pit sizes (why the weekly nut differs)
Broadway: Higher minimum pay rates (the baseline you must pay under union rules). Chorus around $2,400/week and larger orchestra requirements (often 20+ players under Local 802 rules). Result: a bigger weekly payroll.
West End: Lower minimum pay rates under Equity UK/Musicians’ Union, and smaller pits (typically 10–15 players). Result: a lighter weekly payroll.
Marketing & overhead (weekly)
Broadway: Expect ~8–12% of weekly gross on advertising once you’re open. That’s ~$80–$100k on a $1m week, with launch weeks often higher ($50k–$150k range). On top, insurance, ticketing fees, and utilities routinely add tens of thousands per week.
West End: Post-opening marketing typically £20k–£50k/week, helped by cheaper local media and tighter word-of-mouth dynamics. UK energy costs spiked in 2022, but some theatres received temporary government relief, softening the hit.
So what: Broadway’s higher ongoing ad spend plus heavier “other” overhead raises the weekly nut (running cost), pushing producers toward premium pricing to clear breakeven. London’s lighter maintenance spend helps preserve an affordable tranche that keeps discovery alive.
How this adds up
Put together, higher minima + larger pits + base-plus-%-of-gross rent + stop-clauses + heavier weekly overhead make Broadway’s weekly nut structurally higher than the West End’s. That forces premium pricing, shortens discovery windows, and biases the slate toward stars/IP (pre-sold brands). London’s more elastic deals and relief right-size costs and extend runways, so mid-scale originals have time to find an audience.
How much did costs rise post-Covid?
Broadway’s running costs took a structural step-up after Covid.
Producers describe a 30–40% uplift, with large shows that once broke even around $700k/week now needing >$1m/week to turn a profit. London rose by roughly ~20%, but the impact was cushioned by higher Theatre Tax Relief (TTR) rates through the period; typical West End bands remain £150–300k/week for musicals and £80–120k/week for plays.
Once you accept those new baselines, the pricing logic is mechanical.
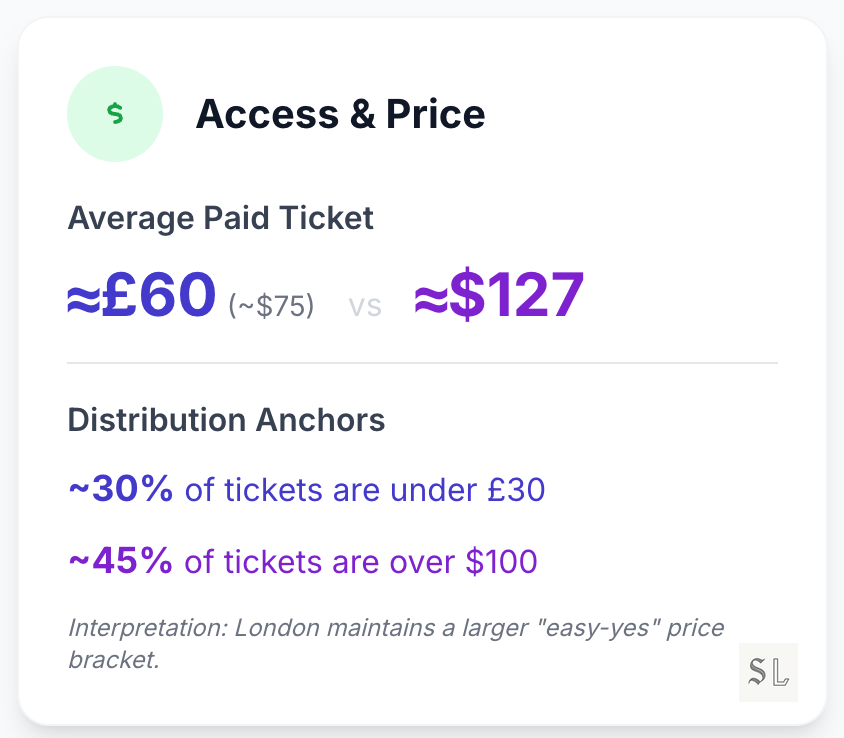
A Broadway musical carrying ~$800k in weekly cost and netting ~80% of gross needs ≈$1.0m/week (roughly 90% capacity at ~$125 average paid) just to stand still. That is why Broadway leans on a the premium seat pricing (many tickets >$100, premiums $200–400+). London, with a lower nut, can preserve a bigger sub-£30 tranche and still clear breakeven; the average paid sits around £60. The distribution shape, not just the means, is the audience experience: habit in London, event in New York.
Case Study A: Stereophonic (Broadway, 2024–25)
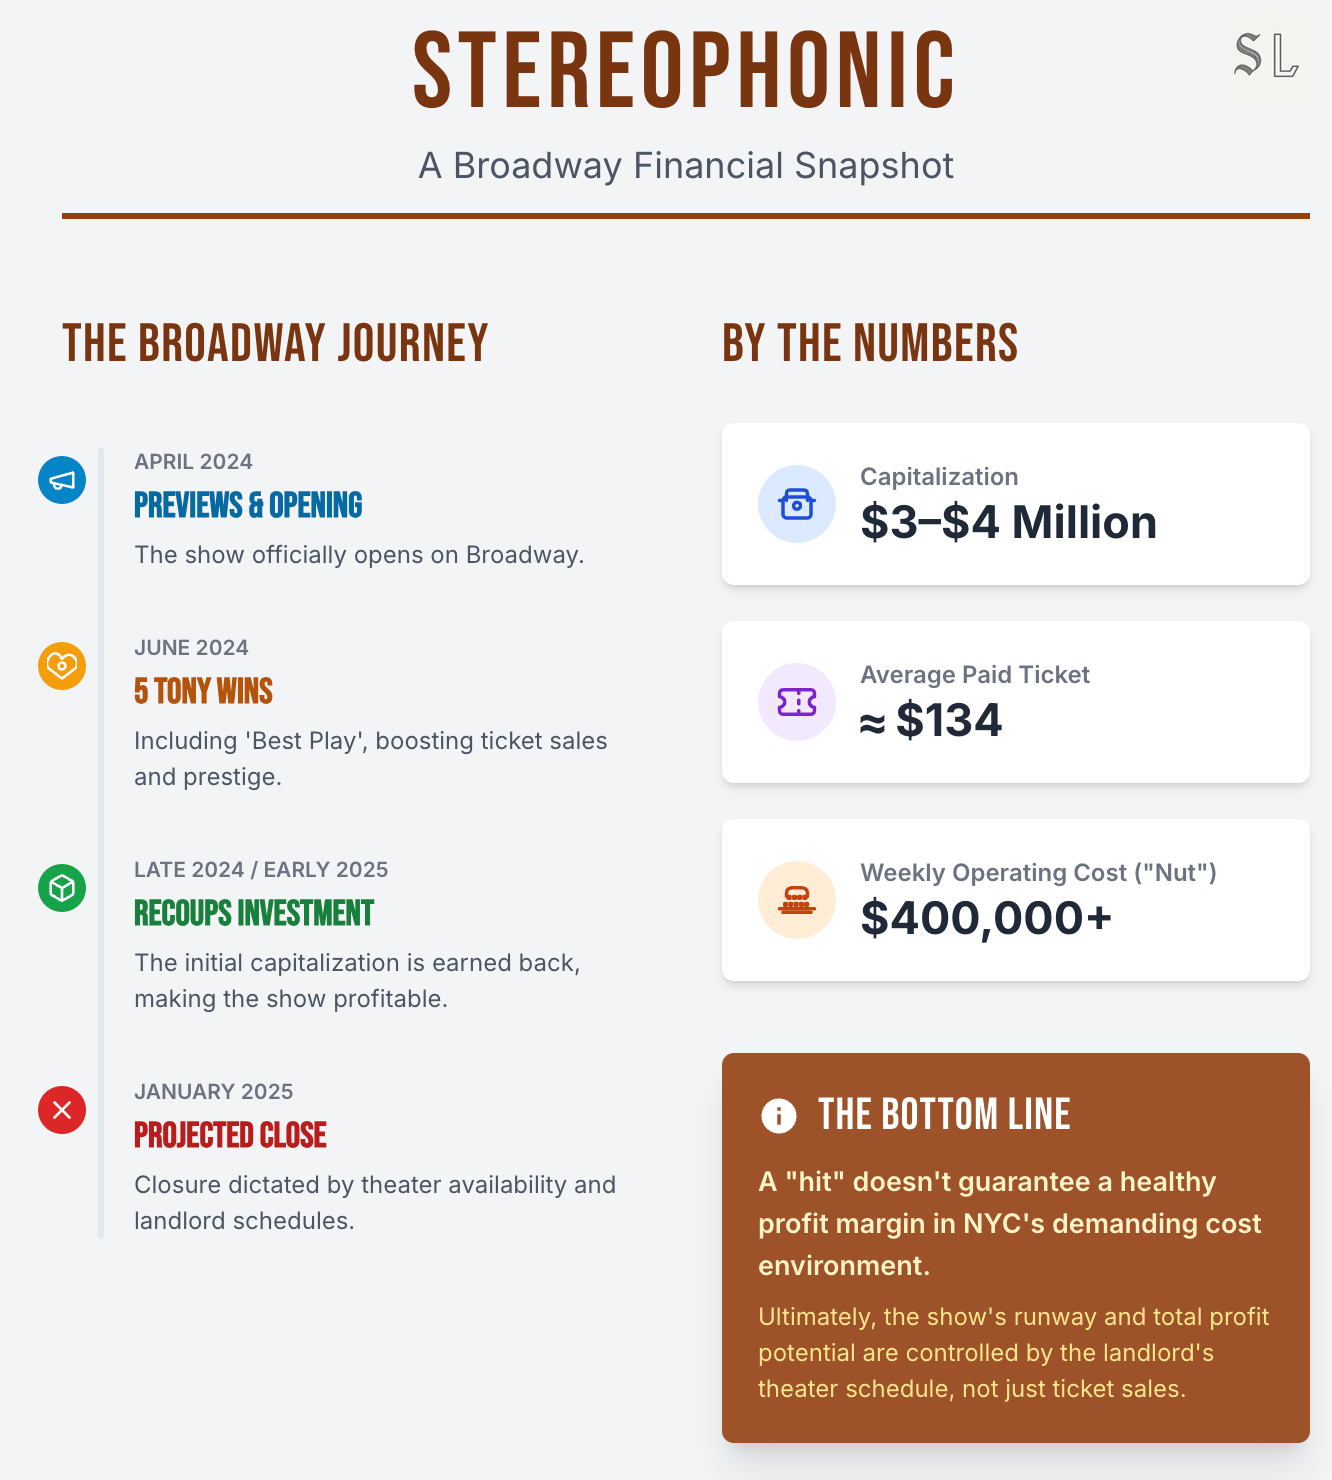
Set-up. A word-of-mouth rocket: opened April 2024, sold out for months, five Tonys, average capacity ~99%, closed January 2025. Capitalisation ≈ $3–4m (cap = total up-front production cost).
The maths behind the euphoria. Average paid ≈ $134 with peak weeks pushing ~$300 premiums; a play of this size still carries a weekly nut ≈ $400k+ (nut = the running cost to keep the show open). At Broadway’s landlord terms (base rent + a % of gross) and with marketing/overheads baked in, the show needed near-record weeks just to stand still.
Outcome. It recouped only a couple of weeks before closing not because demand collapsed, but because the theatre was rebooked. That’s the system laid bare: in New York, even a smash can yield thin operating margins and limited runway when stop-clauses/scheduling trump patience. Hit ≠ healthy margin; runway power sits with landlords, not audiences.
Case Study B: The Play That Goes Wrong (right-sizing across markets)
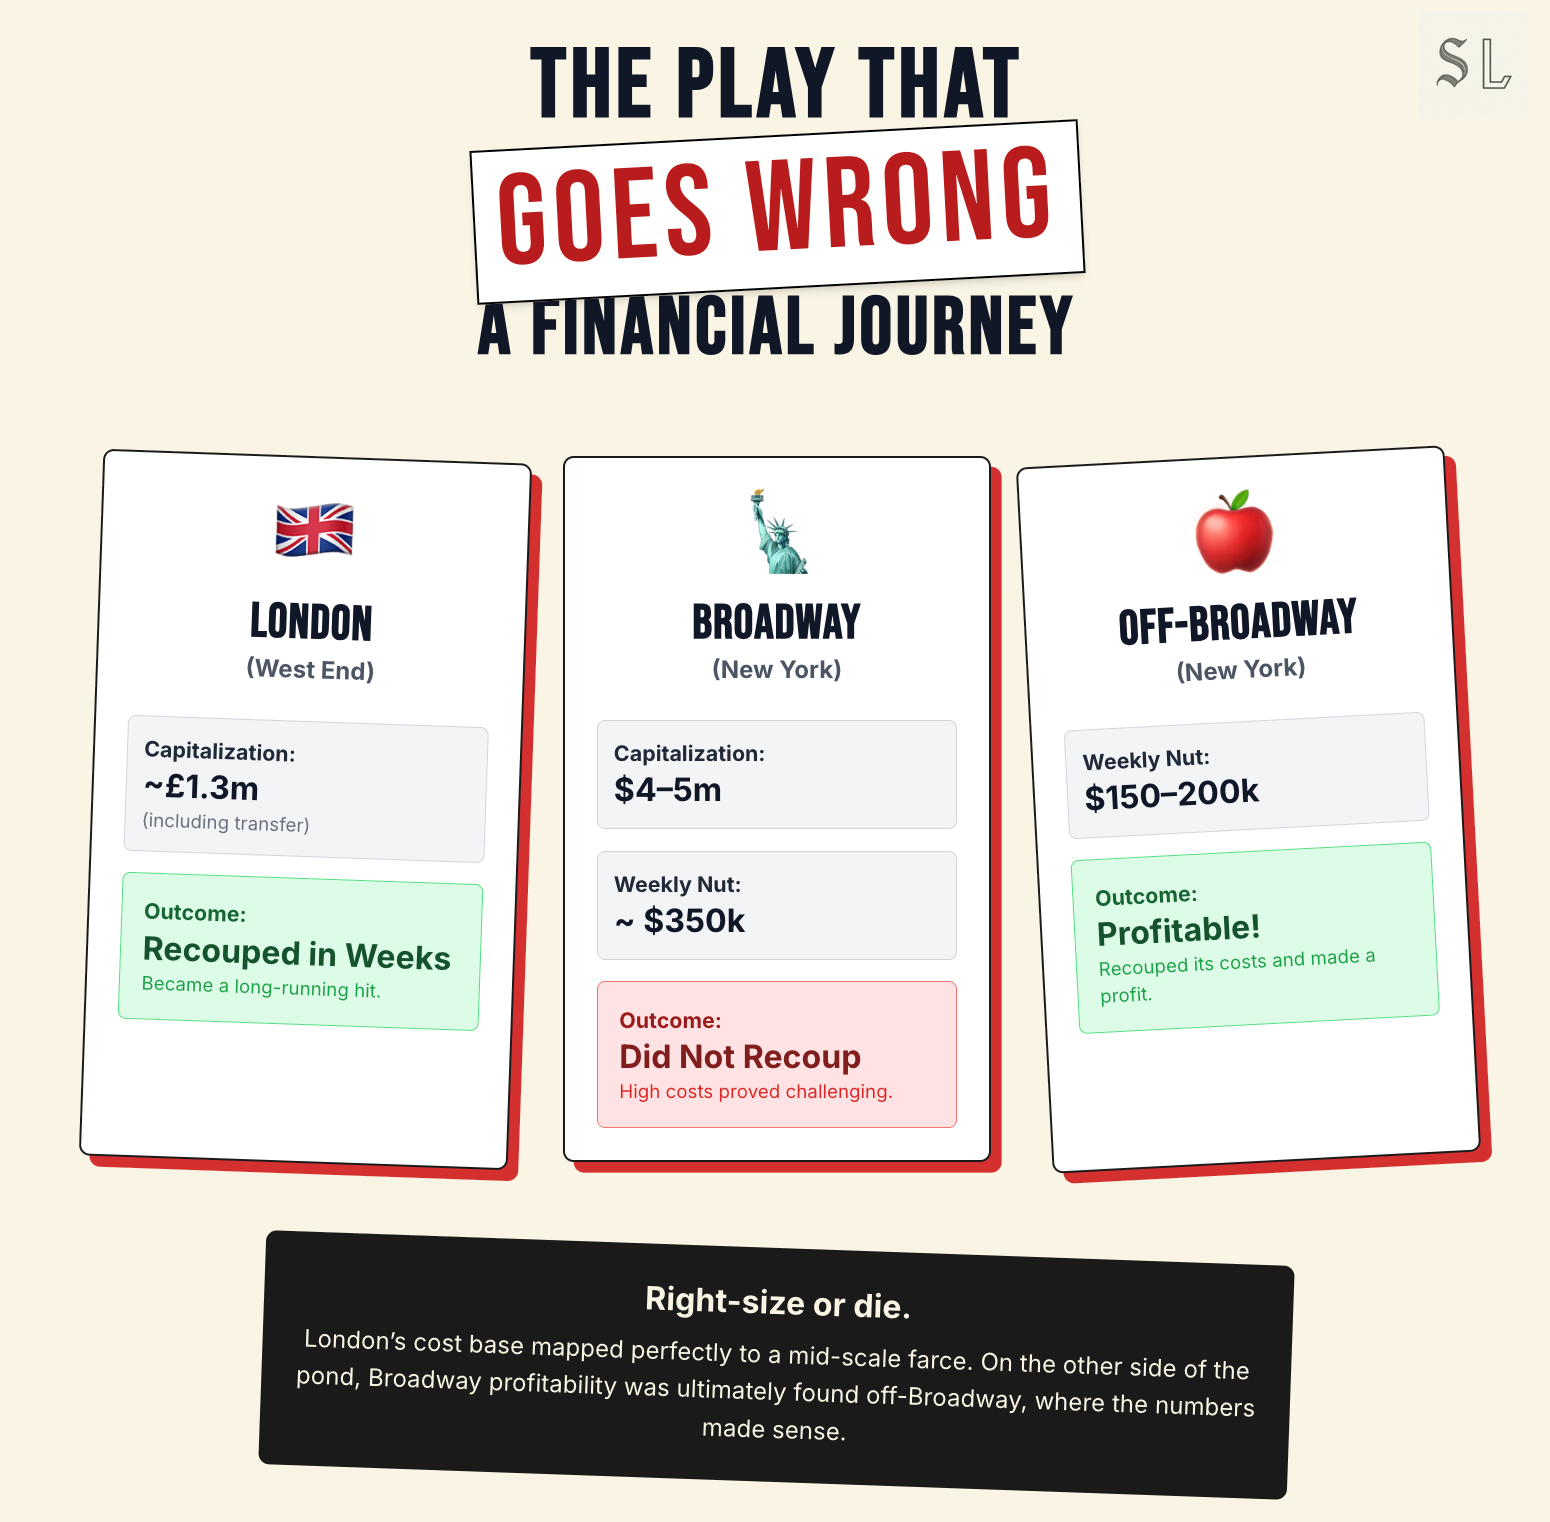
London, where it fits. A ~£300k fringe launch plus ~£1m to transfer to the West End. It recouped in weeks and ran long. The cost base matched the demand curve.
Broadway, where it doesn’t. On Broadway the show stepped up to $4–5m cap with a ~$350k/week nut. It did not recoup. The same farce moved Off-Broadway to New World Stages on a ~$150–200k/week nut and turned profitable.
What that proves. Cost ecology + venue match determine survival. London’s right-sized houses and lower weekly costs keep mid-scale comedy economically alive in-market. Broadway’s mid-scale hole is often solved outside Broadway by reducing the nut until the show and its audience actually align.
Policy as R&D capital
Broadway’s high weekly costs and landlord rules shorten a show’s “discovery window”. London pulls the opposite lever: Theatre Tax Relief (TTR), a cash refund that works like up-front R&D funding for new work.
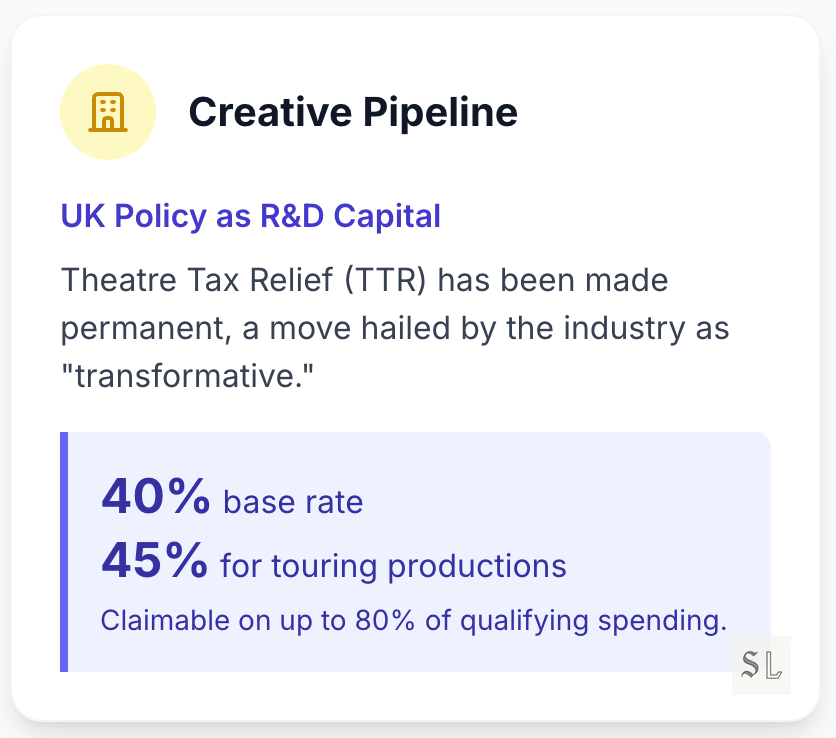
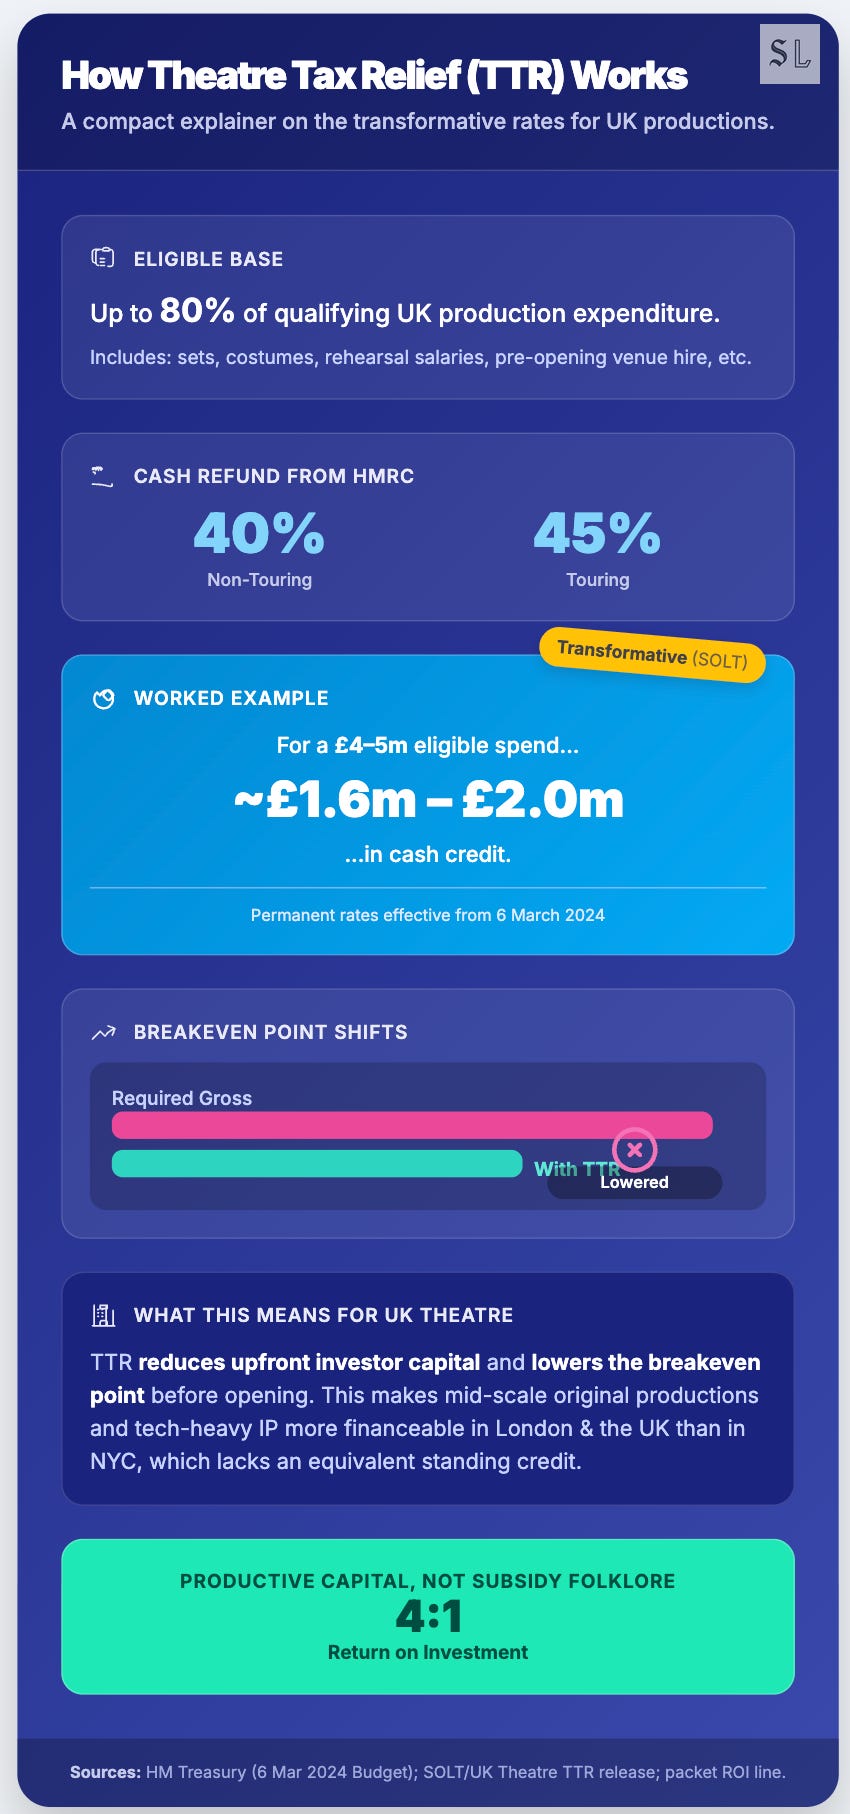
How it works: Since 6 March 2024, TTR is permanent at 40% for non-touring and 45% for touring shows, applied to up to 80% of eligible spend. The UK tax office (HMRC) pays the refund in cash, usually soon after the first tax return. Industry bodies called the permanence “transformative.”
What that means in practice: On a £5m new musical, you can expect roughly £2m back. Producers budget for that refund up front to (1) lower the investor cash at risk, (2) pull break-even down (the weekly income needed just to cover costs), and (3) put more quality on stage from day one.
Does it actually move money? Yes. In 2021–22, HMRC paid £38m in theatre credits that catalysed ≥£163m of production investment, about a 4:1 effect. Usage is rising: claims grew from ~209 (2019) to ~710 (2022) as companies leaned in.
Why this differs from the US: There is no federal theatre credit in the American commercial model. New York City’s production credit was temporary and capped; SVOG (Save Our Stages) was a one-off emergency grant, not a standing incentive.
The Pipeline Effect
So, London reduces risk before opening night, which is why more ambitious or tech-heavy shows open there first, build social proof, and transfer. Stranger Things: The First Shadow is a clean example of how producers use TTR to lower break-even ex ante, prove the concept, and only then weigh a U.S. move.
Case study C: Stranger Things: The First Shadow (policy arbitrage in the wild)
Set-up (why London first). A major U.S. IP launched in London at the Phoenix Theatre (2023) under the UK’s touring-rate Theatre Tax Relief (45% cash refund on up to 80% of eligible costs) alongside lower tech/labour and a receptive horror/sci-fi market. The intent is clear: prove at lower break-even, then evaluate a U.S. transfer with risk already taken out.
The arithmetic. Assume a £6m tech-heavy budget. Under 45% on ≤80% eligibility, the production can receive ≈£2.16m back from HMRC in cash once the first return lands. That is a first-order shift in break-even (the weekly income needed to cover costs) before a single ticket is sold: £6.0m × 0.80 × 0.45 = £2.16m.
In London, policy is a safety net. Theatre Tax Relief works like up-front R&D money: it cuts the cash investors must risk, buys time for discovery, and lets bigger, bolder shows open with a cushion. Once part of the UK build cost (capex, the up-front spend) is paid down by that refund and early sales, a U.S. transfer can be judged on the work with much less financial risk attached.
Repertoire & risk (what the OS selects)
Broadway’s selection pressure = stars/IP/revivals.
With weekly nuts high (the running cost to keep a show open) and stop-clauses in leases (landlord rights to close a show after weak weeks), rational producers tilt toward star vehicles, branded IP (pre-sold brands), and revivals. The pay-off profile reflects it: only ~20% of Broadway musicals recoup (Ken Davenport), and even in boom years just ~20–30% of all Broadway shows return investors’ money (Loeb & Loeb).
London’s breadth = more mid-scale originals.
Lower weekly costs plus public R&D (ACE grants; Theatre Tax Relief) carry more mid-scale work to first production or retool. Pricing discipline helps: SOLT notes the average nominal ticket moved only slightly 2019→2022 and fell in real terms (≈£48 in 2019 pounds in 2022), preserving a credible low-price tranche and sustaining discovery.
Net effect: Broadway concentrates the repertoire into fewer, bigger bets. London diversifies it with more mid-scale bets that stay on stage long enough to find an audience.
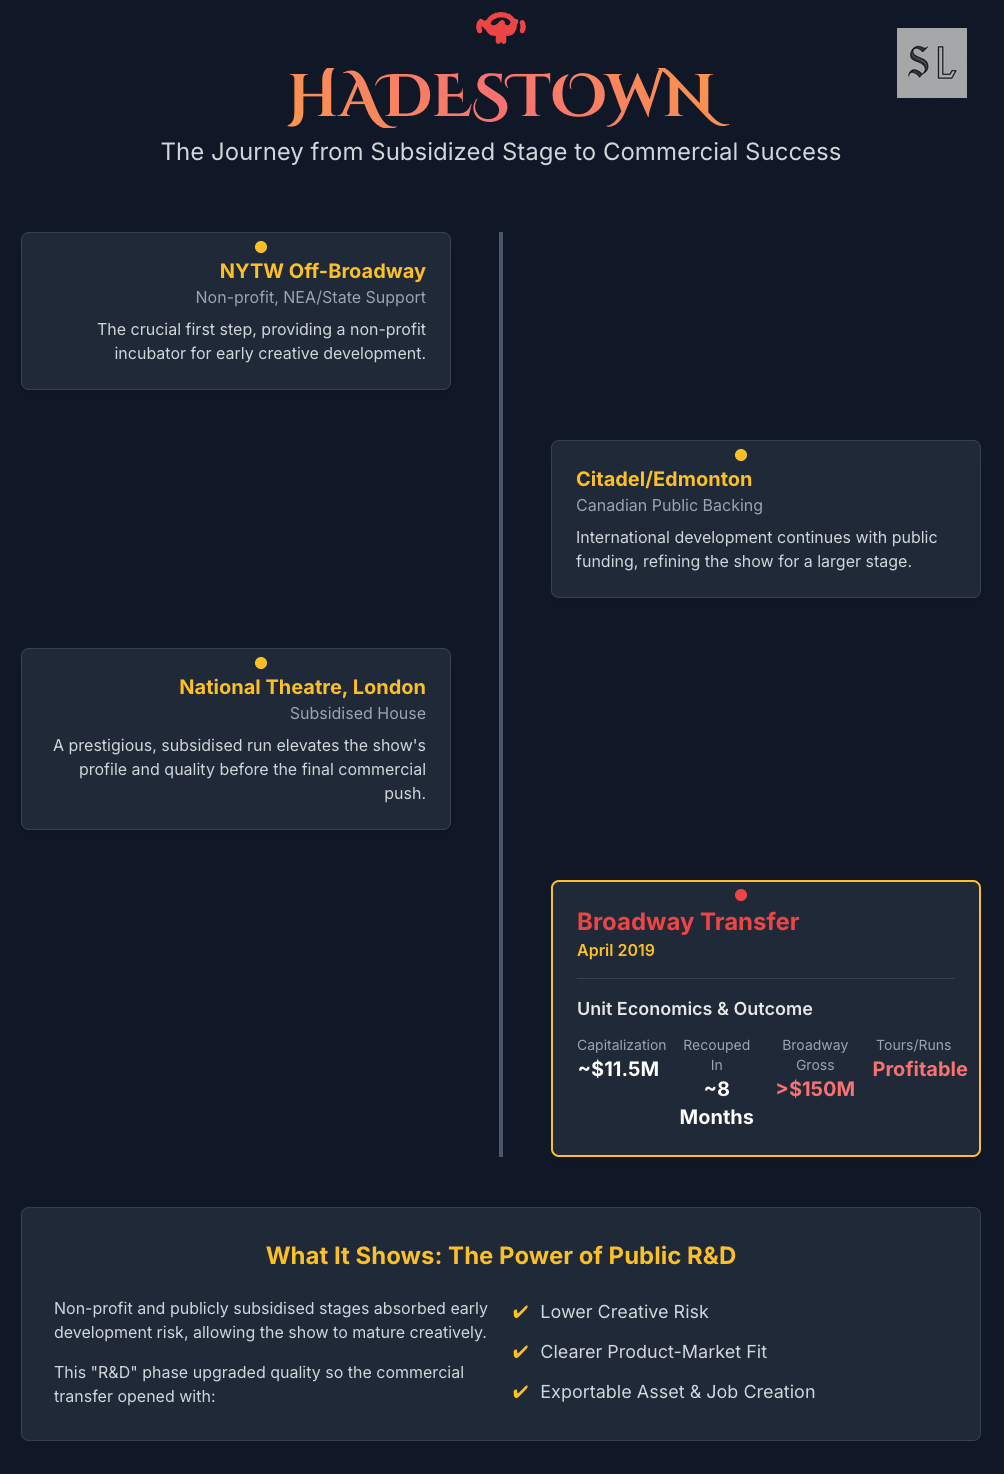
Case Study D: Hadestown (pipeline proof)
Development chain (how it was built): Hadestown didn’t “arrive” on Broadway; it graduated there. It began at NYTW Off-Broadway (non-profit; NEA/state support in the mix), moved to Citadel Theatre, Edmonton (Canadian public backing), then to London’s National Theatre (a subsidised house), and finally transferred to Broadway in April 2019. Each subsidised step absorbed early risk and upgraded the show before it faced New York.
Unit economics (why it could run): Broadway cap ≈ $11.5m; break-even ≈ $600k/week. In 2019 it routinely grossed $800k–$1.0m/week and recouped in ≈ eight months (post-Tonys).
Outcome (what it created): Since then the Broadway run has grossed >$150m, the US tour has been profitable, and the show has played London (i.e., a durable commercial asset and jobs across multiple markets).
What it proves: Non-profit/public R&D → commercial export & jobs. By socialising development risk (NYTW/NEA/Citadel/NT), the show reached Broadway with lower creative risk and clear product–market fit. That is the operating logic we’ve been tracing: publicly underwrite rehearsal; let the market underwrite scale.
Hadestown is the R&D-lab model in action: socialised development ⟶ commercially legible asset ⟶ exportable IP.
Why all this matters
None of this is a taste argument. All of this is an argument about operating systems. London lowers break-even before opening night and New York raises it during the run. That asymmetry doesn’t just change price but the time allowed for a show to launch, to be discovered, to fail usefully. London buys time and Broadway sells it by the week.
The new risk
If London becomes the default lab for ambitious work, the American musical risks keeping its accent while outsourcing its origin story. That matters for artists (where the first draft happens), for audiences (where the first encounter occurs), and for soft power (whose city gets credit for tomorrow’s canon).
The Strange Loop of Commercial Theatre
Price → Audience → Policy → Price
High weekly costs force premium pricing, which narrows habit and weakens political will to fund risk. So costs stay high.
London runs the inverse loop: lower breakeven → visible cheap seats → stronger habit → legitimacy for support → sustained lower breakeven.
Launch geography → Capital → Launch geography
London-first openings create social proof, capital follows proven assets, core premieres shift to London and Broadway becomes the import market for tent-poles.
Gatekeepers → Runway → Repertoire → Gatekeepers
%-of-gross rent + stop-clauses shorten runways, slow-burn originals thin out, and then landlords rotate in higher-grossing titles all reinforcing the same deal shapes.
What’s next in the series
Essay II: The tour is the real market. More people see theatre outside of NYC and London than within it. We’ll see how policy decides who actually gets culture beyond the capitals. The UK has 45% touring relief + ACE support vs the US Road (guarantees, logistics, subscriptions). Expect a county-by-county view of which towns go dark, which titles scale down, and where the price floor lands.
Essay III: NEA futures. We’ll map what the NEA really funds and model pause/cut scenarios for presenters, education and the talent pipeline. The question is simple: remove the leverage, and how fast do mid-scale tours, jobs, and downstream IP evaporate?
